Little Calumet River Flood Levels
| Stage | Elevation | Event / Flood Response Level |
|---|---|---|
| 26.5 | 601.5 | 500-Year Flood |
| 25.0 | 600.0 | Black Level |
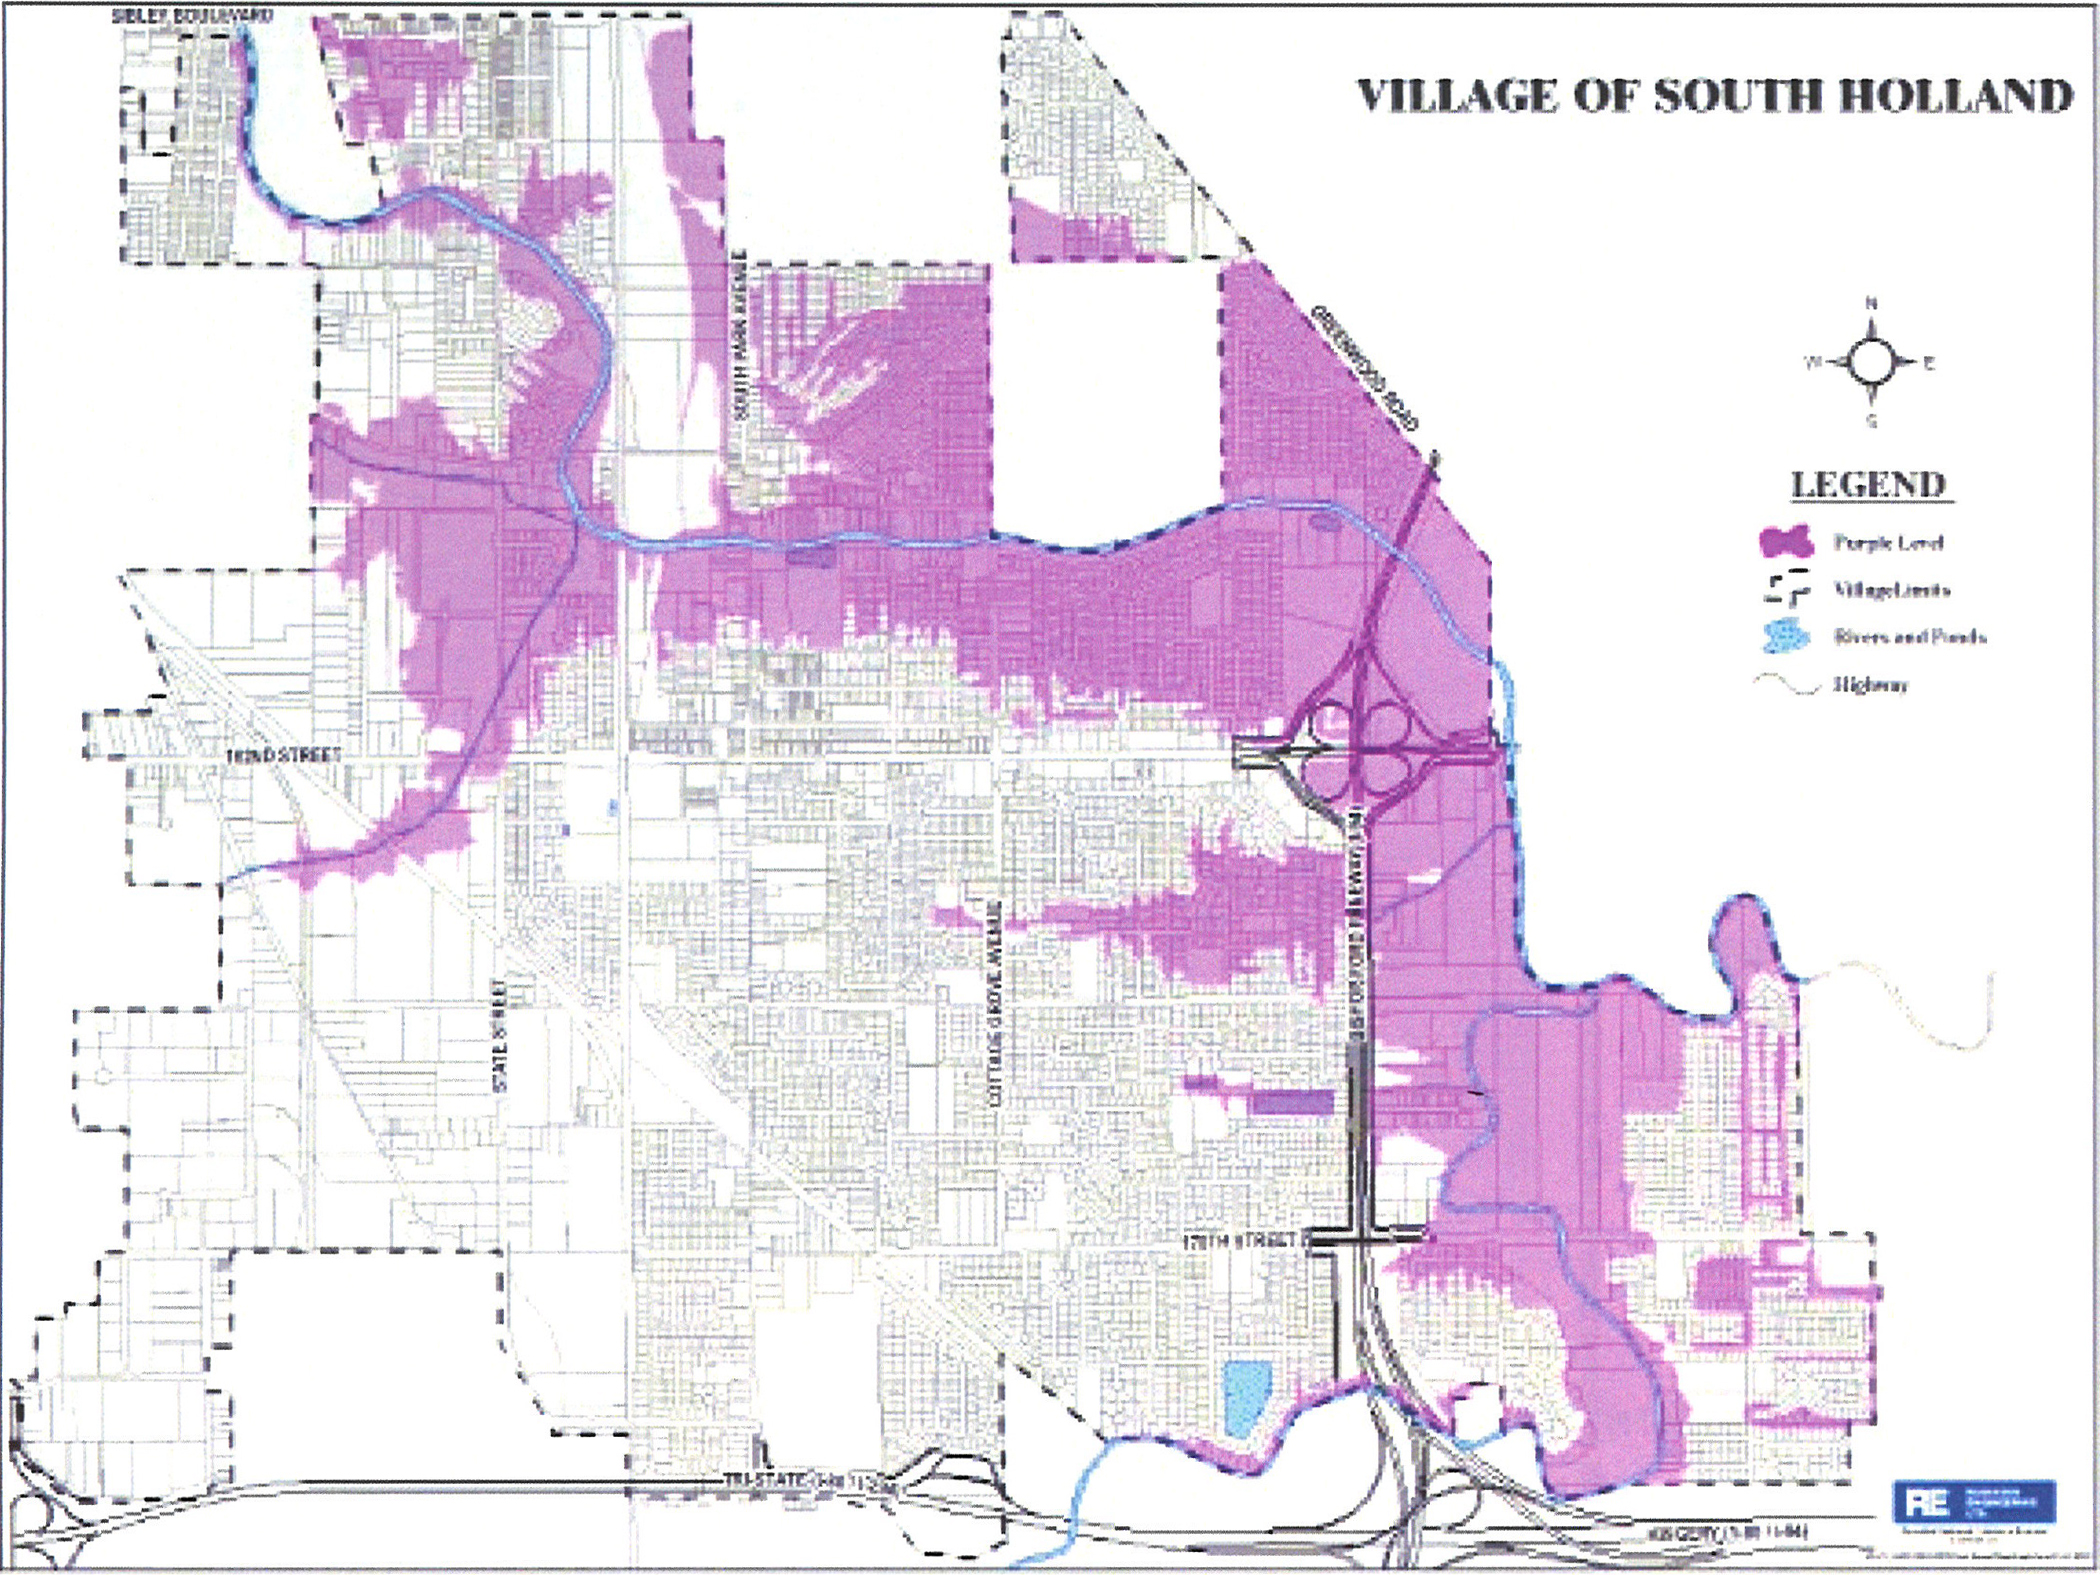
| 23.0 | 598.0 | Purple Level 100-Year Flood |
| 22.0 | 597.0 | 50-Year Flood |
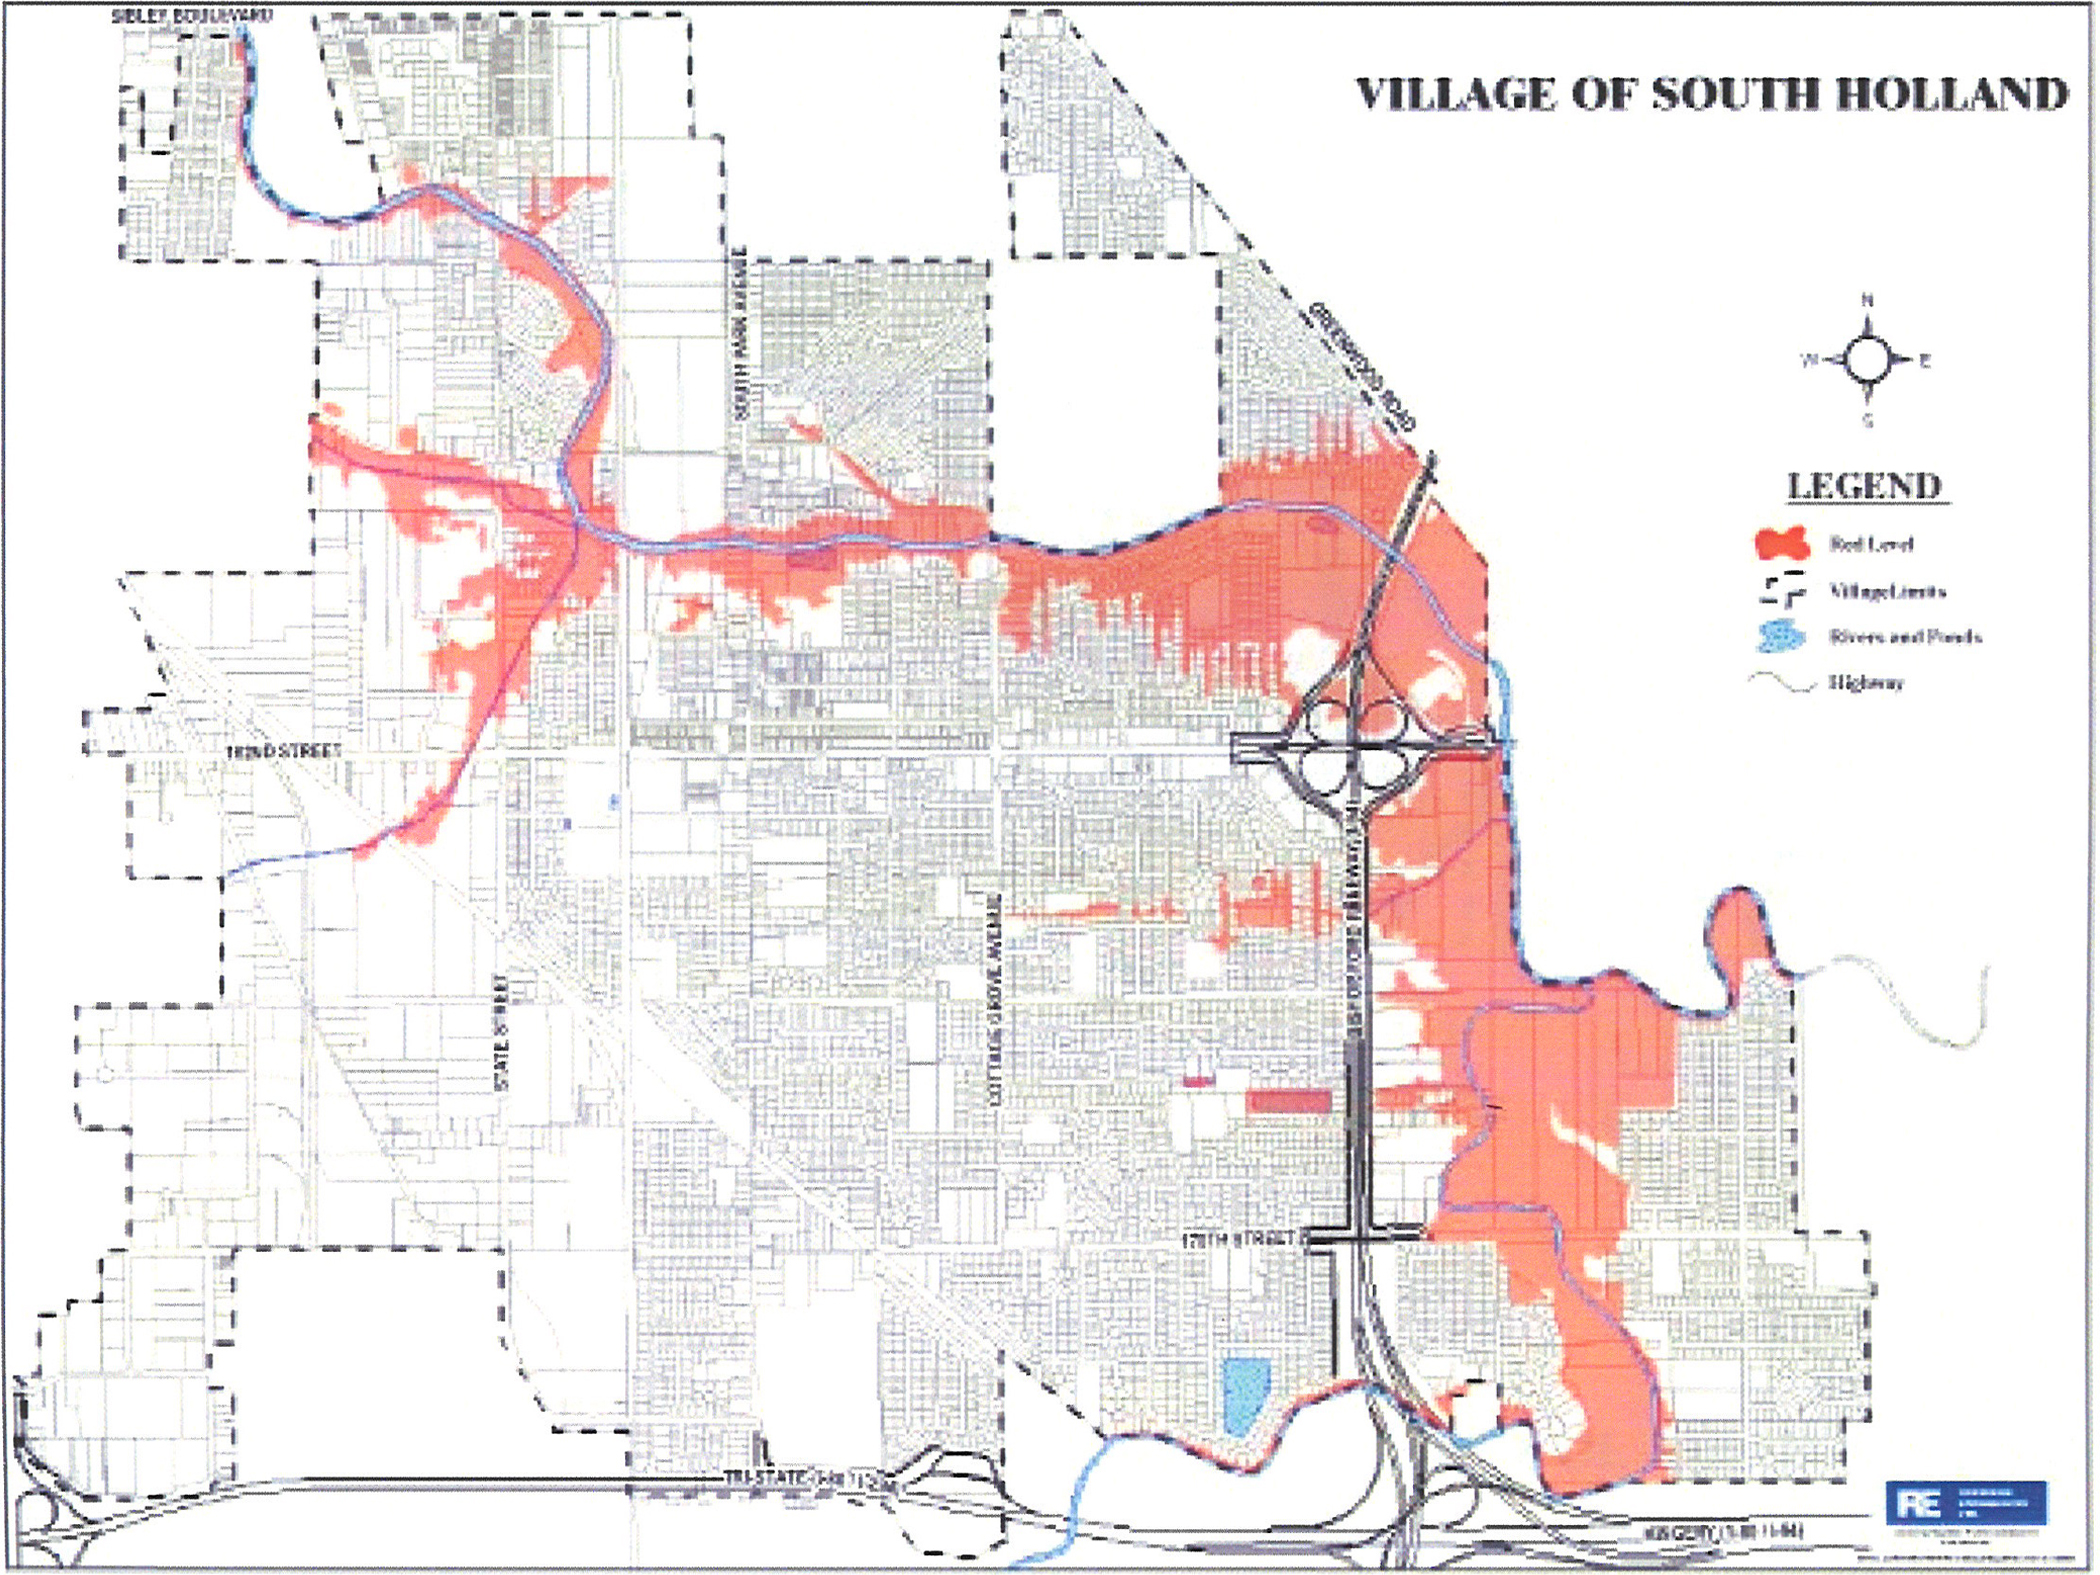
| 21.0 | 596.0 | Red Level |
| 20.8 | 595.8 | November 27, 1990 |
| 20.2 | 595.2 | June 14, 1981 |
| 20.1 | 595.1 | July 14, 1957 |
| 20.0 | 595.0 | Orange Level July 20, 1996 |
| 19.6 | 594.6 | December 3, 1982 |
| 19.4 | 594.4 | 10-Year Flood |
| 19.2 | 594.2 | April 6, 1947 |
| 19.1 | 594.1 | February 21, 1997 |
| 19.0 | 594.0 | Yellow Level Water reaches buildings on Drexel |
| 18.6 | 593.6 | June 2, 1989 |
| 18.2 | 593.2 | October 10, 1954 |
| 18.0 | 593.0 | Thorn Creek begins to cover 170th Street |
| 17.9 | 592.9 | February 24, 1985 Water covers streets at Riverview and Drexel |
| 17.7 | 592.7 | December 27, 1965 |
| 17.0 | 592.0 | Flood Warning issued |
| 16.5 | 591.5 | National Weather Service Flood Stage |
| 16.0 | 591.0 | Flood Watch starts |
| 15.0 | 590.0 | Water enters Veterans Park |
Flood heights have been recorded since 1947 on a river gauge that is currently located at the Cottage Grove Avenue bridge over the Little Calumet River. Recorded flood heights can be shown in stage or in elevation. Stage is measured in feet above an arbitrary starting point that was set when the gage was first installed. Elevations are in feet above sea level. Stage of zero on this gauge is the same as an elevation of 575.0 feet above sea level.
“Flood stage” is the elevation where the rising river stars to damage property. Yards and parks are flooded when the river reaches an elevation of approximately 590 feet above sea level. Buildings are affected at approximately 593 feet.
The National Weather Service provides real time stage data for the upstream river gauge on the Little Calumet River at South Holland.
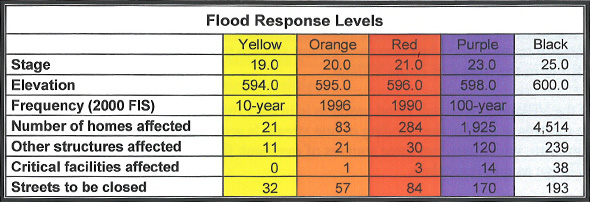
The Village of South Holland uses five flood response levels. The levels and the impact of a flood at each level are shown in the table below. The relation between the levels and past floods are shown in the graph to the right (click the graph for a larger view). The red level is roughly the equivalent to the highest flood in recent memory, the flood of November 1990, which crested at 595.8 feet.
Maps of each flood level are below. Click each map for a larger view.
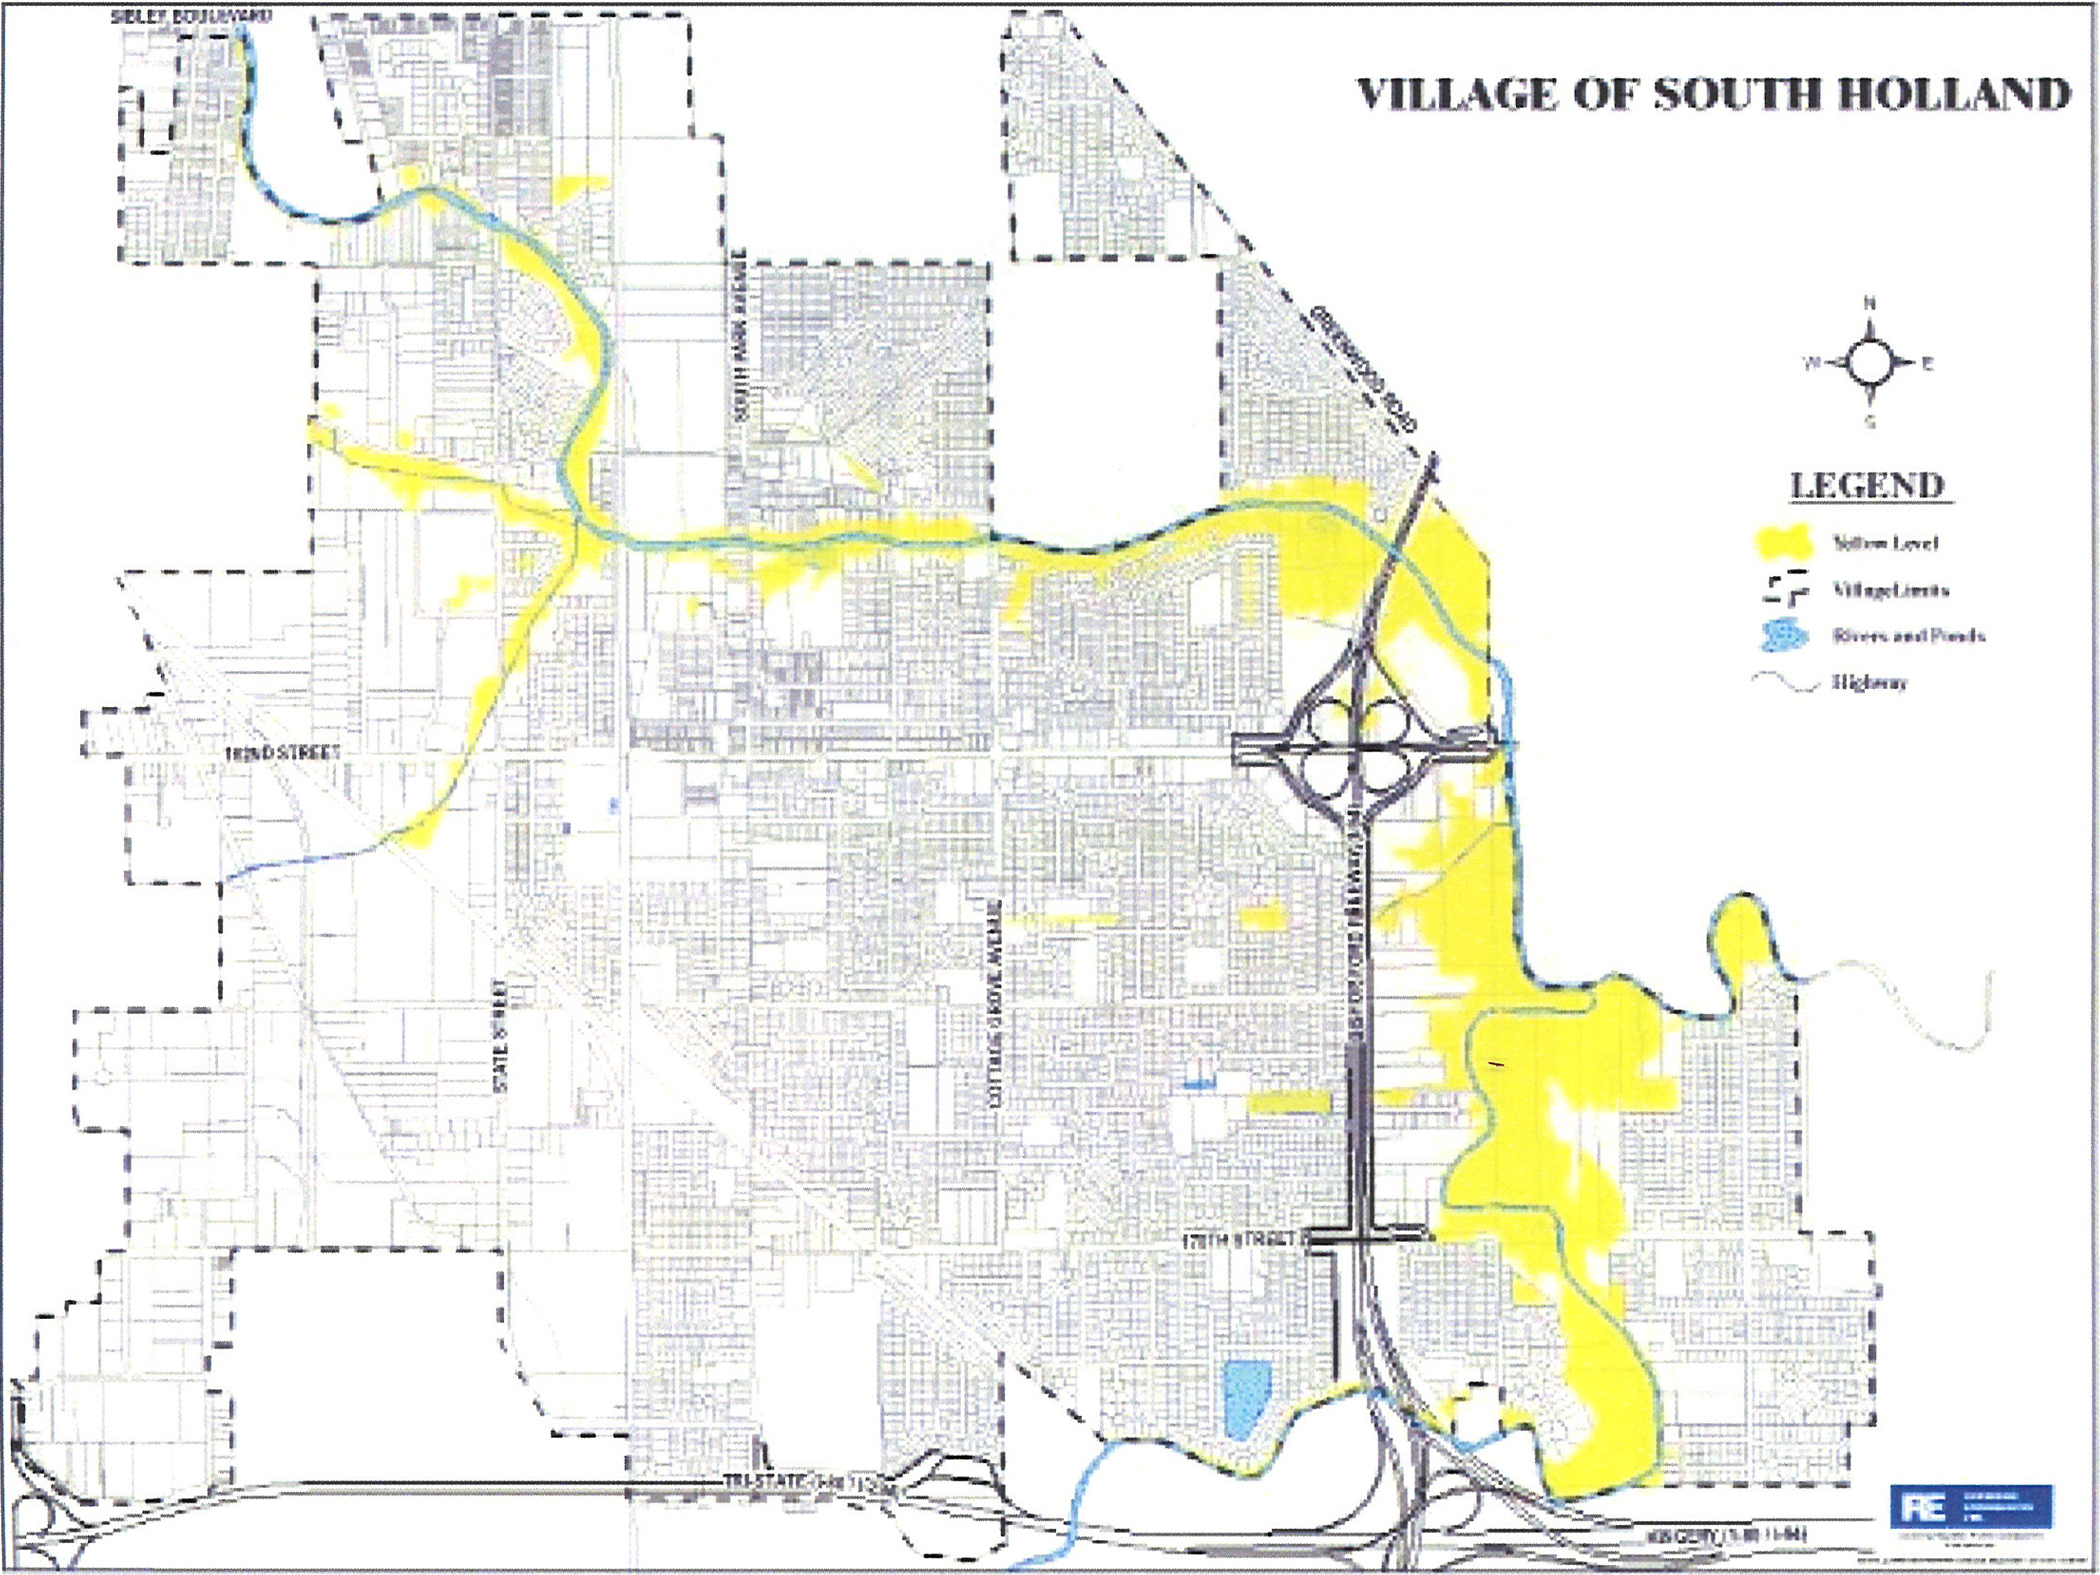
Yellow Level Floodplain Map
Flood Stage 19 feet
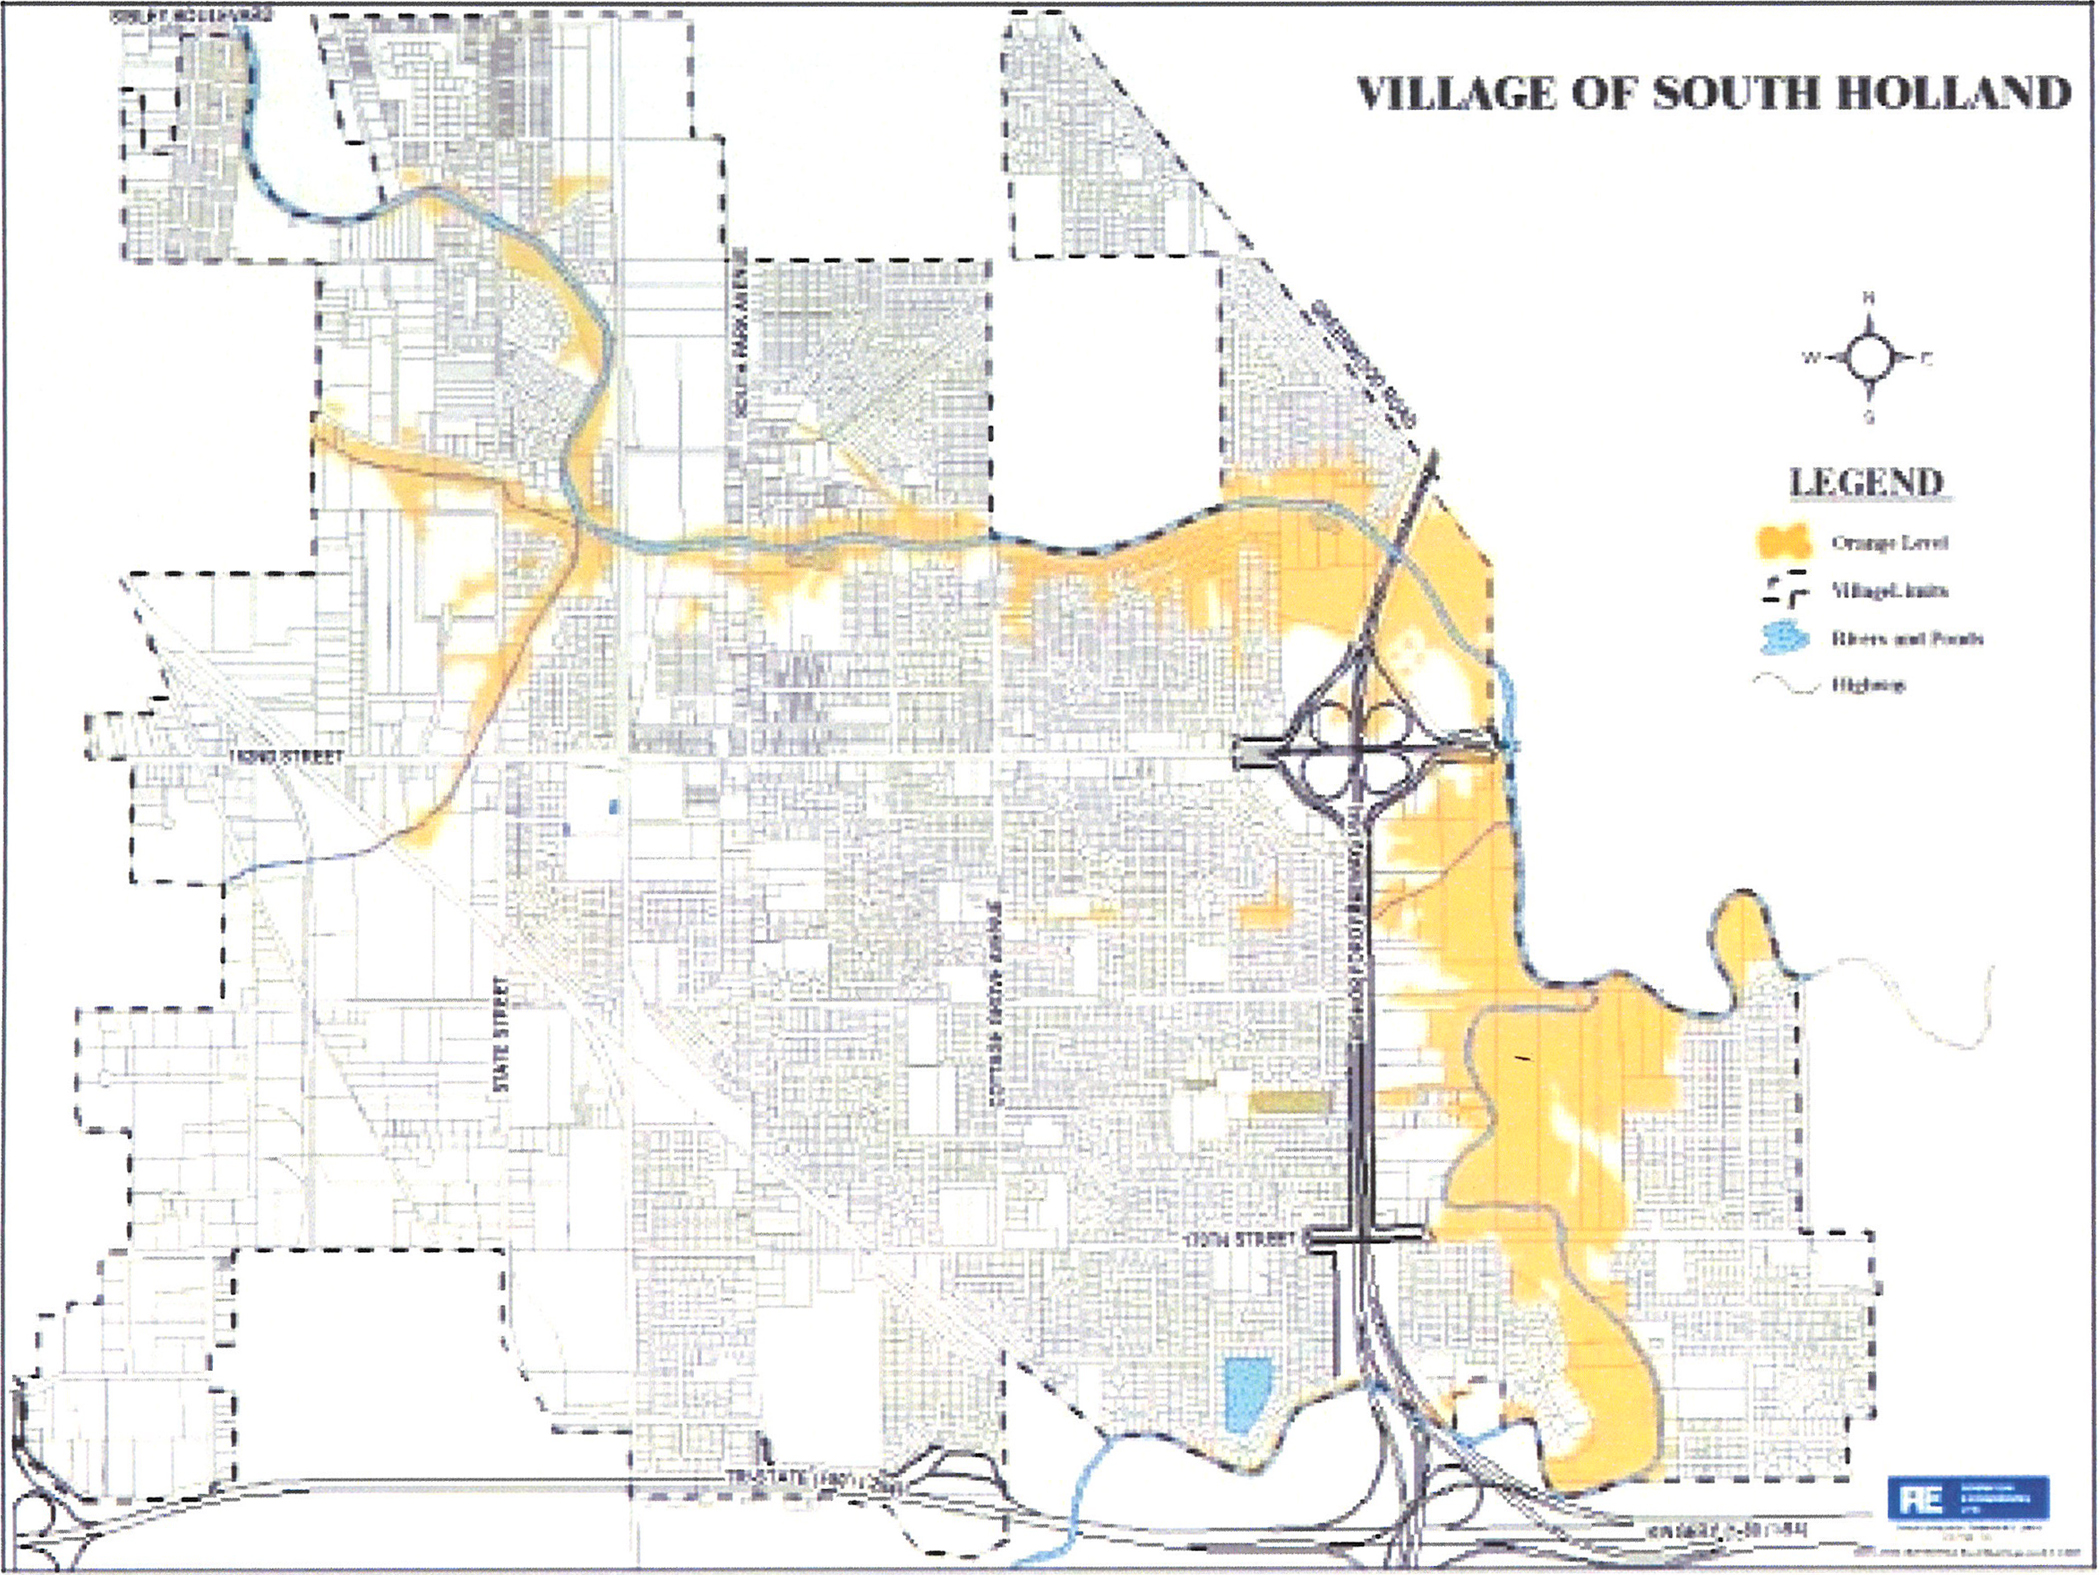
Orange Level Floodplain Map
Flood Stage 20 feet
Red Level Floodplain Map
Flood Stage 21 feet
Purple Level Floodplain Map
Flood Stage 23 feet
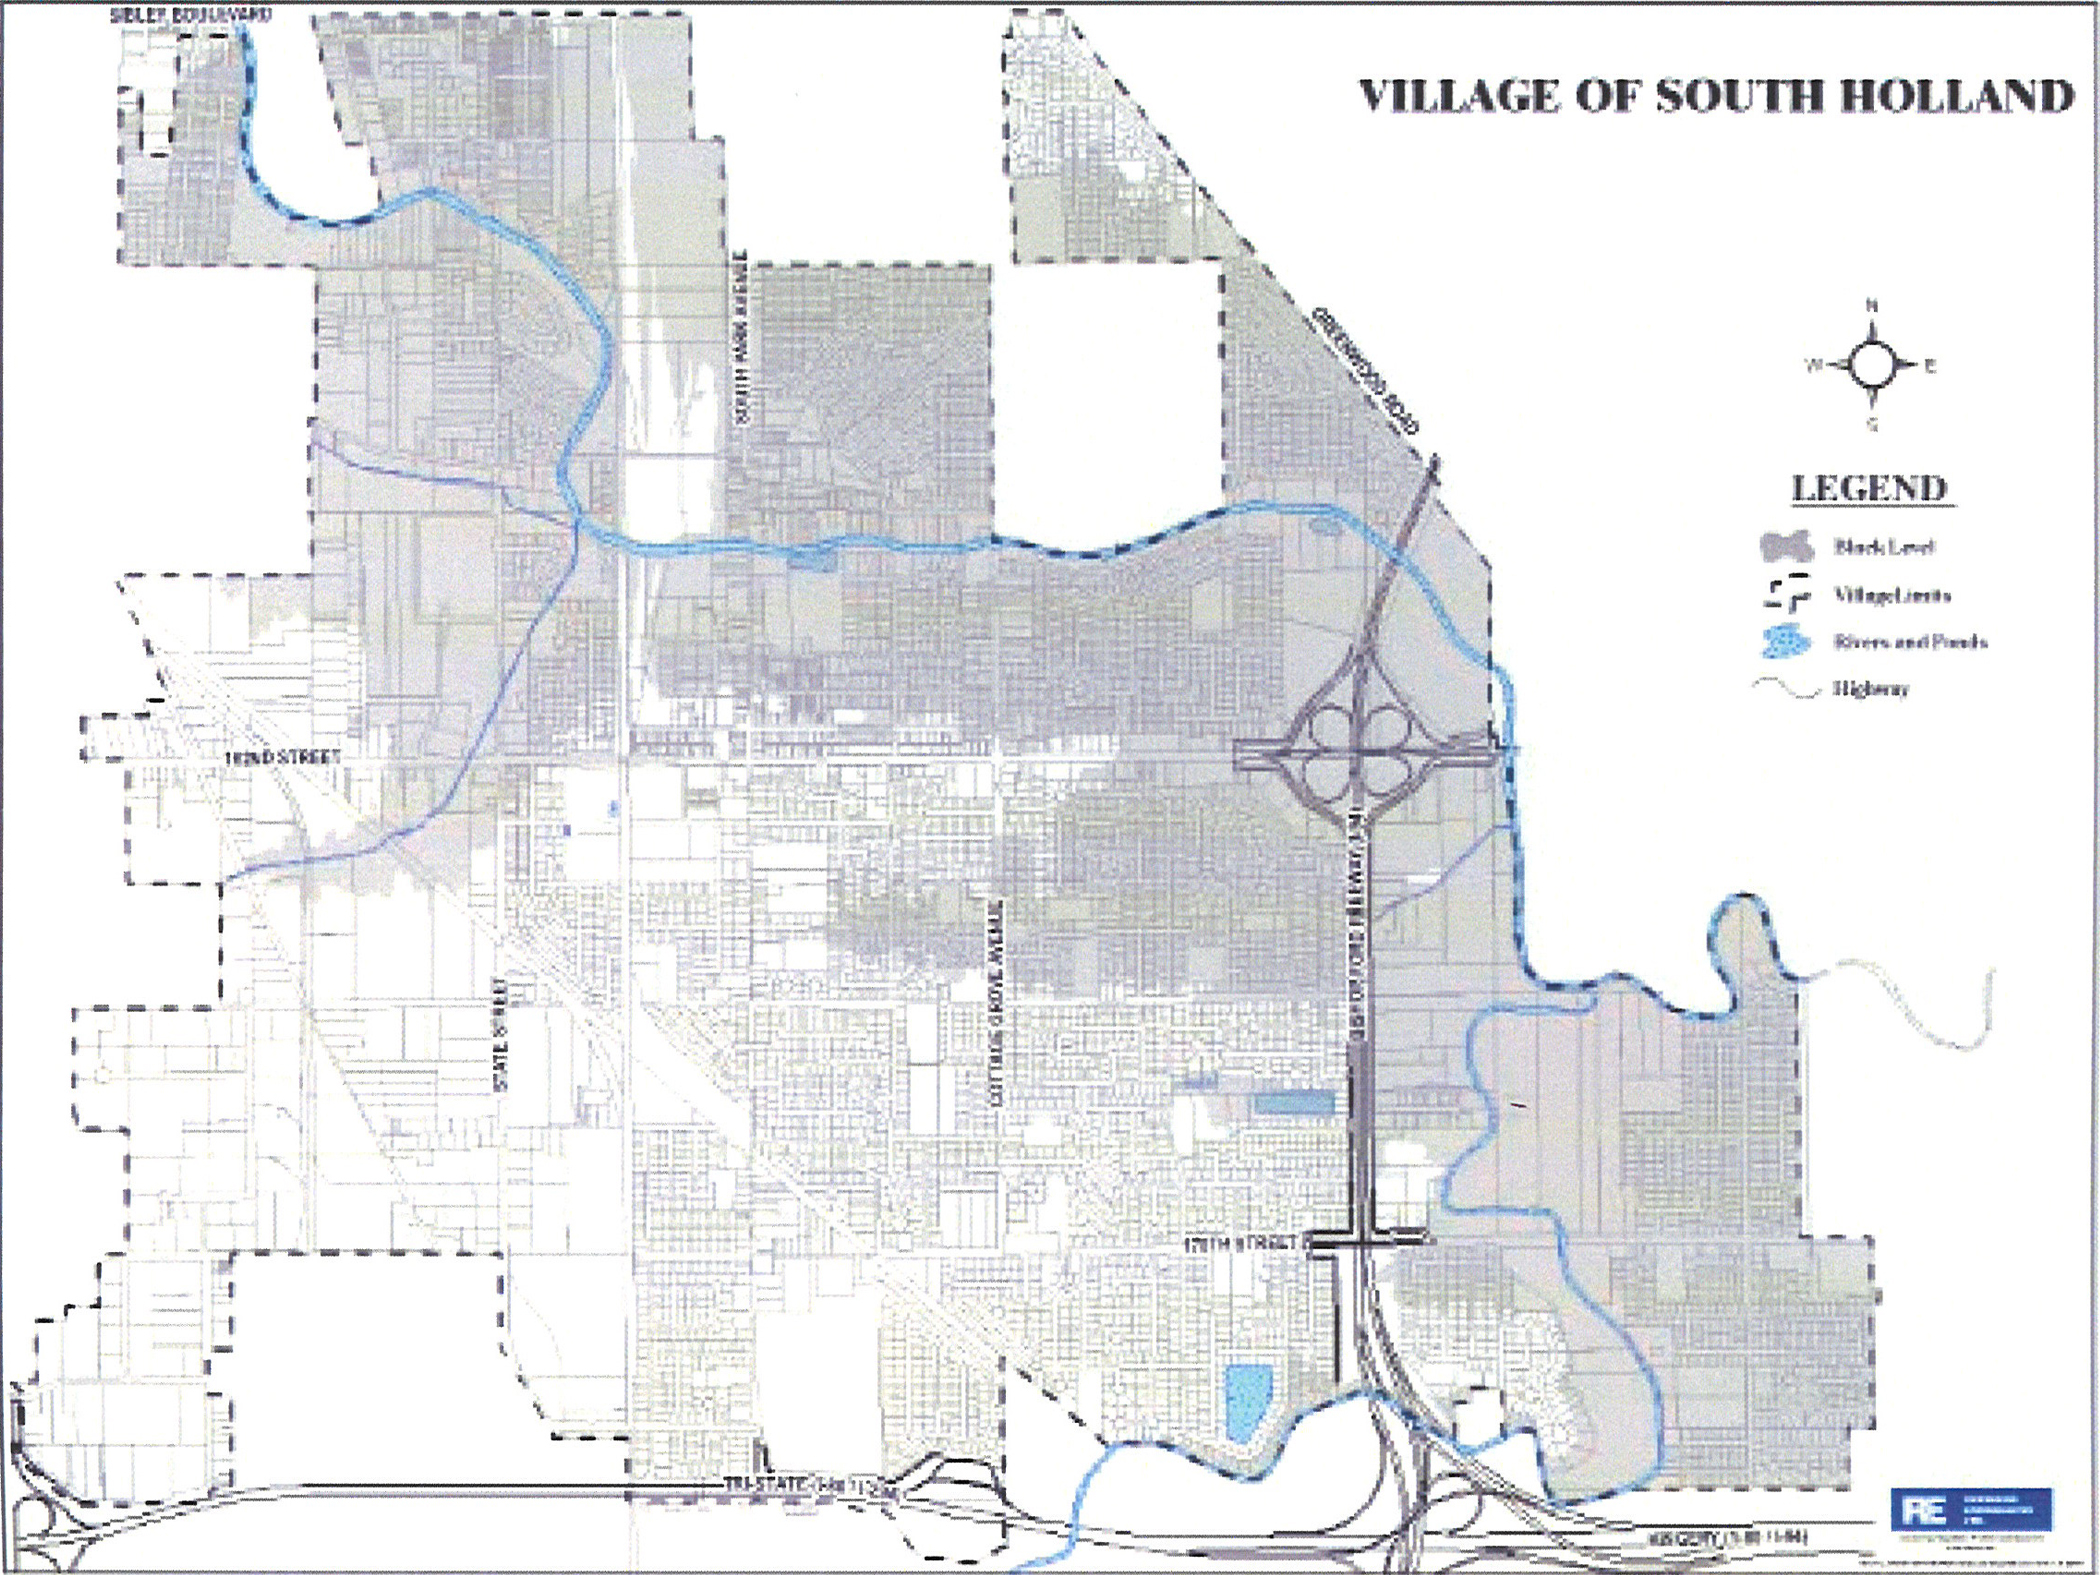
Black Level Floodplain Map
Flood Stage 25 feet